Prerequirement: concept of bar chart
The problem we establish in this post is to compute the area of a bar chart, that is a chart like the following:

Of course the area is given by the sum of the areas of the individual rectangles making up the chart, and the area of each rectangle is given by the product of its basis for its height, so in order to do the calculation it’s enough to know all the bases and all the heights. So let’s establish a notation: given that the bar chart is composed of n rectangles, we indicate by c_1, c_2, \ldots, c_n the bases of the rectangles, numbered from left to right, and with f(1), f(2), \ldots, f(n) the respective heights:
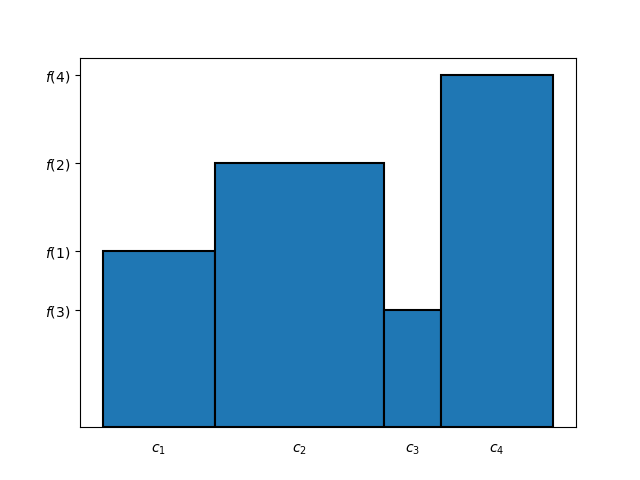
We can suppose, for generality, all the bases to be non-negative real numbers (including the limit case of null bases) and that heights are any real numbers (including the limit case of null heights). In particular, about heights, we can suppose f to be a function from \{1, 2, \ldots, n\} to \mathbb{R}, where f(i) is the height of the i-th rectangle (if f assumes a negative value, it means that the corresponding rectangle is turned upside down, that is it’s placed under the horizontal axis). In the example we have (c_1, c_2, c_3, c_4) = (2, 3, 1, 2) and (f(1), f(2), f(3), f(4)) = (3, 9/2, 2, 6).
With this notation, the area of the bar chart is given by the formula:
Or, in a more concise way:
So, if we call A the area of Figure 2, we have that
Now we see another method, rather creative, for computing this area. At the end we’ll obtain a lemma that will turn useful in several occasions, starting from the next post.
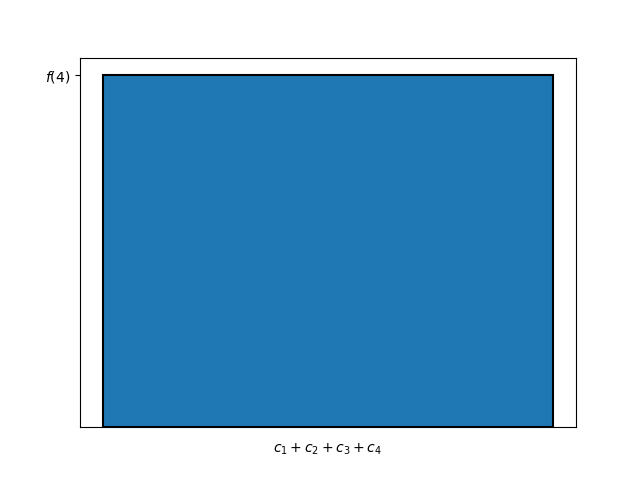
With this method the area is obtained as sum of areas of some rectangles, but in a very different way. The first rectangle has the sum of all bases as basis, and as height that of the last rectangle:
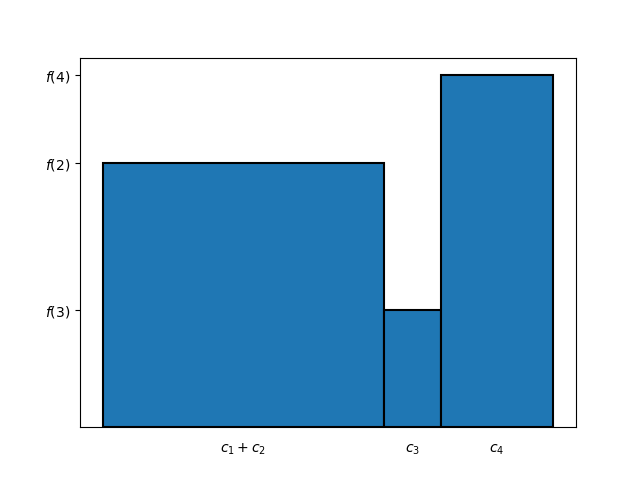
Now, starting from this big rectangle, we operate in order to obtain the contour of the last rectangle of the bar chart. For doing this, we have to subtract the following rectangle:
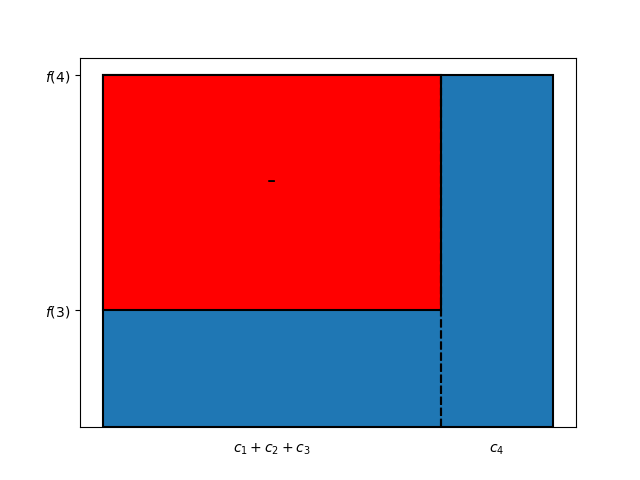
The basis of this rectangle is the sum of the first three bases (c_1 + c_2 + c_3) and its height is the difference between the heights of the last two rectangles (f(4) - f(3)). Erasing it, we obtain the following picture:
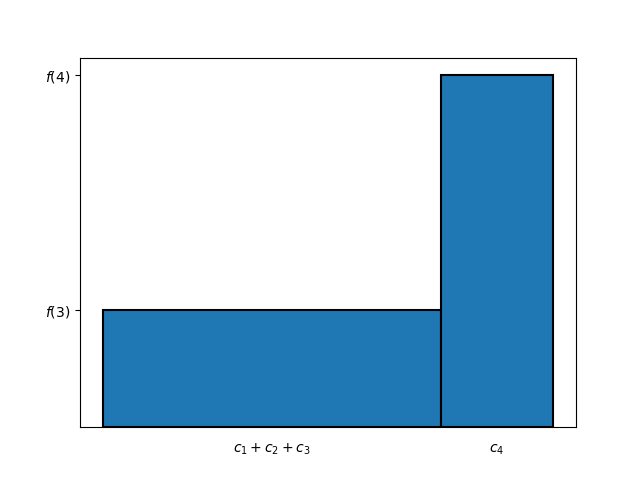
Now we do an analogous operation, operating in such a way to obtain the contour of the penultimate rectangle of the bar chart. This time we have to add the following rectangle, the basis of which is the sum of the first two bases (c_1 + c_2) and the height of which is the difference f(2) - f(3):
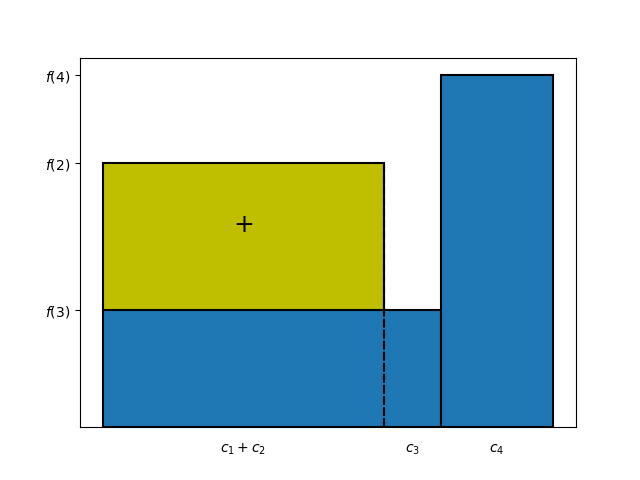
So we obtain the following picture:
Now the last step remains:
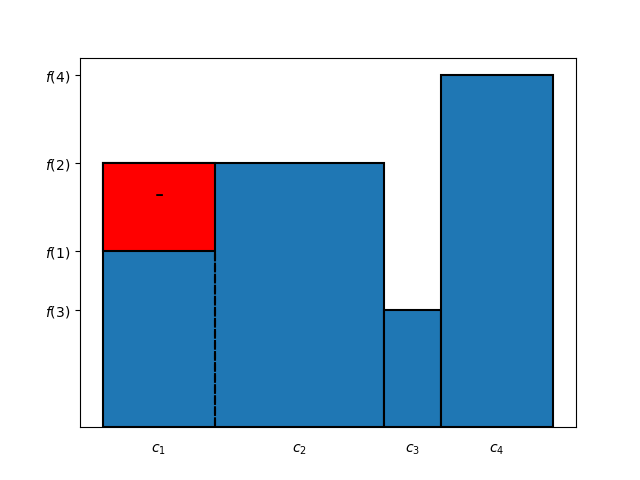
We subtracted the rectangle having basis c_1 and height f(2) - f(1): doing this operation we obtain the original bar chart of Figure 2.
Summarizing, we started from Figure 3 and, after a series of rectangle additions and subtractions, we arrived to the bar chart of Figure 2. So, from the area point of view, we can say that the area of Figure 2 can be obtained starting from the area of Figure 3 and adding/subtracting the areas of the rectangles we added/subtracted each time:
\begin{aligned}&A =& \\&(c_1 + c_2 + c_3 + c_4) f(4)&\text{(area of Figure 3)}\\-&(c_1 + c_2 + c_3)(f(4) - f(3)) &\text{(area of the rectangle subtracted in the first step)}\\+&(c_1 + c_2)(f(2) - f(3))&\text{(area of the rectangle added in the second step)}\\-&c_1 (f(2) - f(1))&\text{(area of the rectangle subtracted in the last step)} \tag{2}\end{aligned}Actually, this equality is correct: you can verify this by substituting (1) in place of A and doing calculations.
We can simplify (2) by observing that:
- we used the – sign (i.e. we subtracted a rectangle) when the next rectangle is higher than the previous one (the fourth is higher than the third, and the second is higher than the first);
- we used tre + sign (i.e. we added a rectangle) when the previous rectangle is higher than the next one (the second is higher than the third).
However, if you think about it, this distinction is an unnecessary complication, because we can obtain the same result by always subtracting the height of the next rectangle from that one of the previous (f(3) - f(4), f(2) - f(3) and f(1) - f(2)) and always using the + sign, without worrying about the relative heights of the rectangles. In other terms, (2) can be rewritten in a simpler way as follows:
\begin{aligned}&A = \\&(c_1 + c_2 + c_3 + c_4) f(4)\\+&(c_1 + c_2 + c_3)(f(3) - f(4)) \\+&(c_1 + c_2)(f(2) - f(3)) \\+&c_1 (f(1) - f(2))\tag{3}\end{aligned}Another improvement we can do, for making the expression easier to read, is to give a name to the sums c_1, c_1 + c_2, c_1 + c_2 + c_3 and c_1 + c_2 + c_3 + c_4, i.e. the sums of the first k bases, with variable k. So we define:
In this way formula (3) becomes:
We can note that C_1 = c_1 by definition: the sum of the first basis alone, without other addends, is itself.
Equation (4) can be easily generalized to bar charts with any number n of rectangles, as follows:
Or, in compact notation:
We note that in the compact notation the sum is inverted as compared to (5): if developed, becomes C_1 (f(1) - f(2)) + \ldots + C_{n-1} (f(n-1) - f(n)) + C_n f(n). This is in order to follow the convention about the summation symbol, where usually the index (in this case k) runs from a smaller number to an higher one; of course the result does not change, by the commutative property of sum.
We have so obtained the following Lemma:
The lemma of bar chart area
Let c_1, c_2, \dots, c_n be non-negative real numbers, with n > 0. Let f: \{1, 2, ..., n\} \rightarrow \mathbb{R} be a function. Then the area A of the bar chart made up of n rectangles, each having basis c_i and height f(i), given by
A = c_1 f(1) + c_2 f(2) + \ldots + c_n f(n) = \sum_{i=1}^{n} c_i f(i) \tag{6}can be also computed with the formula
\begin{aligned}A &= C_n f(n) + C_{n-1} (f(n-1) - f(n)) + \ldots + C_1 (f(1) - f(2)) \\&= \sum_{k = 1}^{n-1} C_k (f(k) - f(k + 1)) + C_n f(n)\end{aligned} \tag{7}where C_k := c_1 + c_2 + \ldots + c_k = \sum_{i=1}^{k} c_i.
At this point you may ask: why complicating our life with formula (7), if a simpler formula for computing the area exists, and it’s (6)?
Though more complicated, the advantage of formula (7) is simply that it’s different: often in mathematics the most interesting discoveries originate from seeing the same things in different ways. In addition, more specifically, formula (7) introduces the constants C_k that could have a meaning by themselves, apart from being sum of the c_is, as we’ll see in the next posts.
In the next post we’ll see a first application of this Lemma to number theory.